What the Transfer Portal Is Actually Doing: Why Capital Is Moving Faster Than Decision Quality
By Scott Krotee
Trends from Jan 6 to Jan 11 based on commitments, average impact, and incoming FMV
After six days of portal data, one thing is clear:
The portal isn't converging.
It's diverging.
Capital allocation and transactions are accelerating rapidly.
Decision efficiency is not.
Programs aren't gravitating toward a single "best" strategy — they're separating into distinct behavioral camps, and the gaps between them are widening.
Maybe transaction, communication, and contract software is getting better — but data-driven decision making is not.
1. Volume Is Accelerating Faster Than Impact
From Jan 6 to Jan 11:
- Total commitments across top portal programs rose sharply
- But average impact scores did not rise at the same rate
Example: Oklahoma State
- Jan 6: low-20s commitments, ~$4–5M FMV
- Jan 11: 39 commitments, $7.17M FMV
- Avg DSA Impact: ~0.51 → ~0.52
What this means:
Scale is increasing much faster than quality density.
Programs adding aggressively are absorbing more variance — not necessarily more upside.
2. Capital Deployment Has Outpaced Efficiency
Across the top 10 programs by FMV:
- Jan 6 top FMV ≈ $3–4M
- Jan 11 top FMV ≈ $7M+
That's nearly a 2× increase in capital flow in less than a week.
But average impact among those same programs:
- Stayed mostly between 0.50–0.56
- With only a few breaking above 0.58
Interpretation:
Money is moving faster than signal.
This sets up a second-order question coaches will care about later:
Who actually converted spend into wins?
3. A Small Group Is Scaling Without Dilution
While many programs saw impact flatten as volume rose, a few did not.
Colorado (Jan 6 → Jan 11)
- Commitments: ~10 → 25
- FMV: ~$1.8M → $4.38M
- Avg Impact: ~0.59 → ~0.57
That drop is minimal relative to the 2.4× increase in volume.
Signal:
Colorado is demonstrating controlled scaling — adding players and preserving quality.
This is rare.
4. Indiana Emerged as a True "Impact Mover"
Indiana didn't dominate early FMV charts — but over time:
- Commitments increased steadily
- Avg DSA Impact stayed above 0.60
- FMV crossed $2.4M with only ~10 commits
From Jan 6 to Jan 11, Indiana moved upward, not just rightward, on the chart.
Why this matters:
This is a non-blueblood executing an impact-first portal strategy — fewer players, higher leverage per slot.
One of the strongest hidden signals in the dataset.
5. The "Volume Trap" Is Becoming Visible
Programs like Iowa State illustrate a clear trend:
- High and growing commitment counts
- FMV steadily increasing
- Avg impact drifting below the median
From Jan 6 → Jan 11:
- Volume rose meaningfully
- Impact did not
Result:
Clear separation into the lower-right quadrant.
This didn't show up on Day 1.
It only becomes obvious with time-series data.
6. The Portal Has Split Into Three Archetypes
By Jan 11, the data shows:
1. Capital Deployers
High volume, high FMV, moderate impact
(Oklahoma State)
2. Scaled Precision Builders
Growing volume, above-median impact, controlled efficiency
(Colorado, Texas Tech)
3. Impact Optimizers
Lower volume, high impact density, strong ROI per slot
(Indiana, Cal, Penn State)
These groups were blurry on Jan 6.
They are undeniable by Jan 11.
The Big Takeaway
Daily portal updates show activity.
Multi-day analysis shows strategy.
Over the past week:
- Capital has surged
- Volume has exploded
- Efficiency has become the true differentiator
Workflow and communication are getting easier.
Data-driven decision making is not.
The portal is no longer about who's active.
It's about who can scale without breaking impact.
That answer is starting to reveal itself — in the numbers.
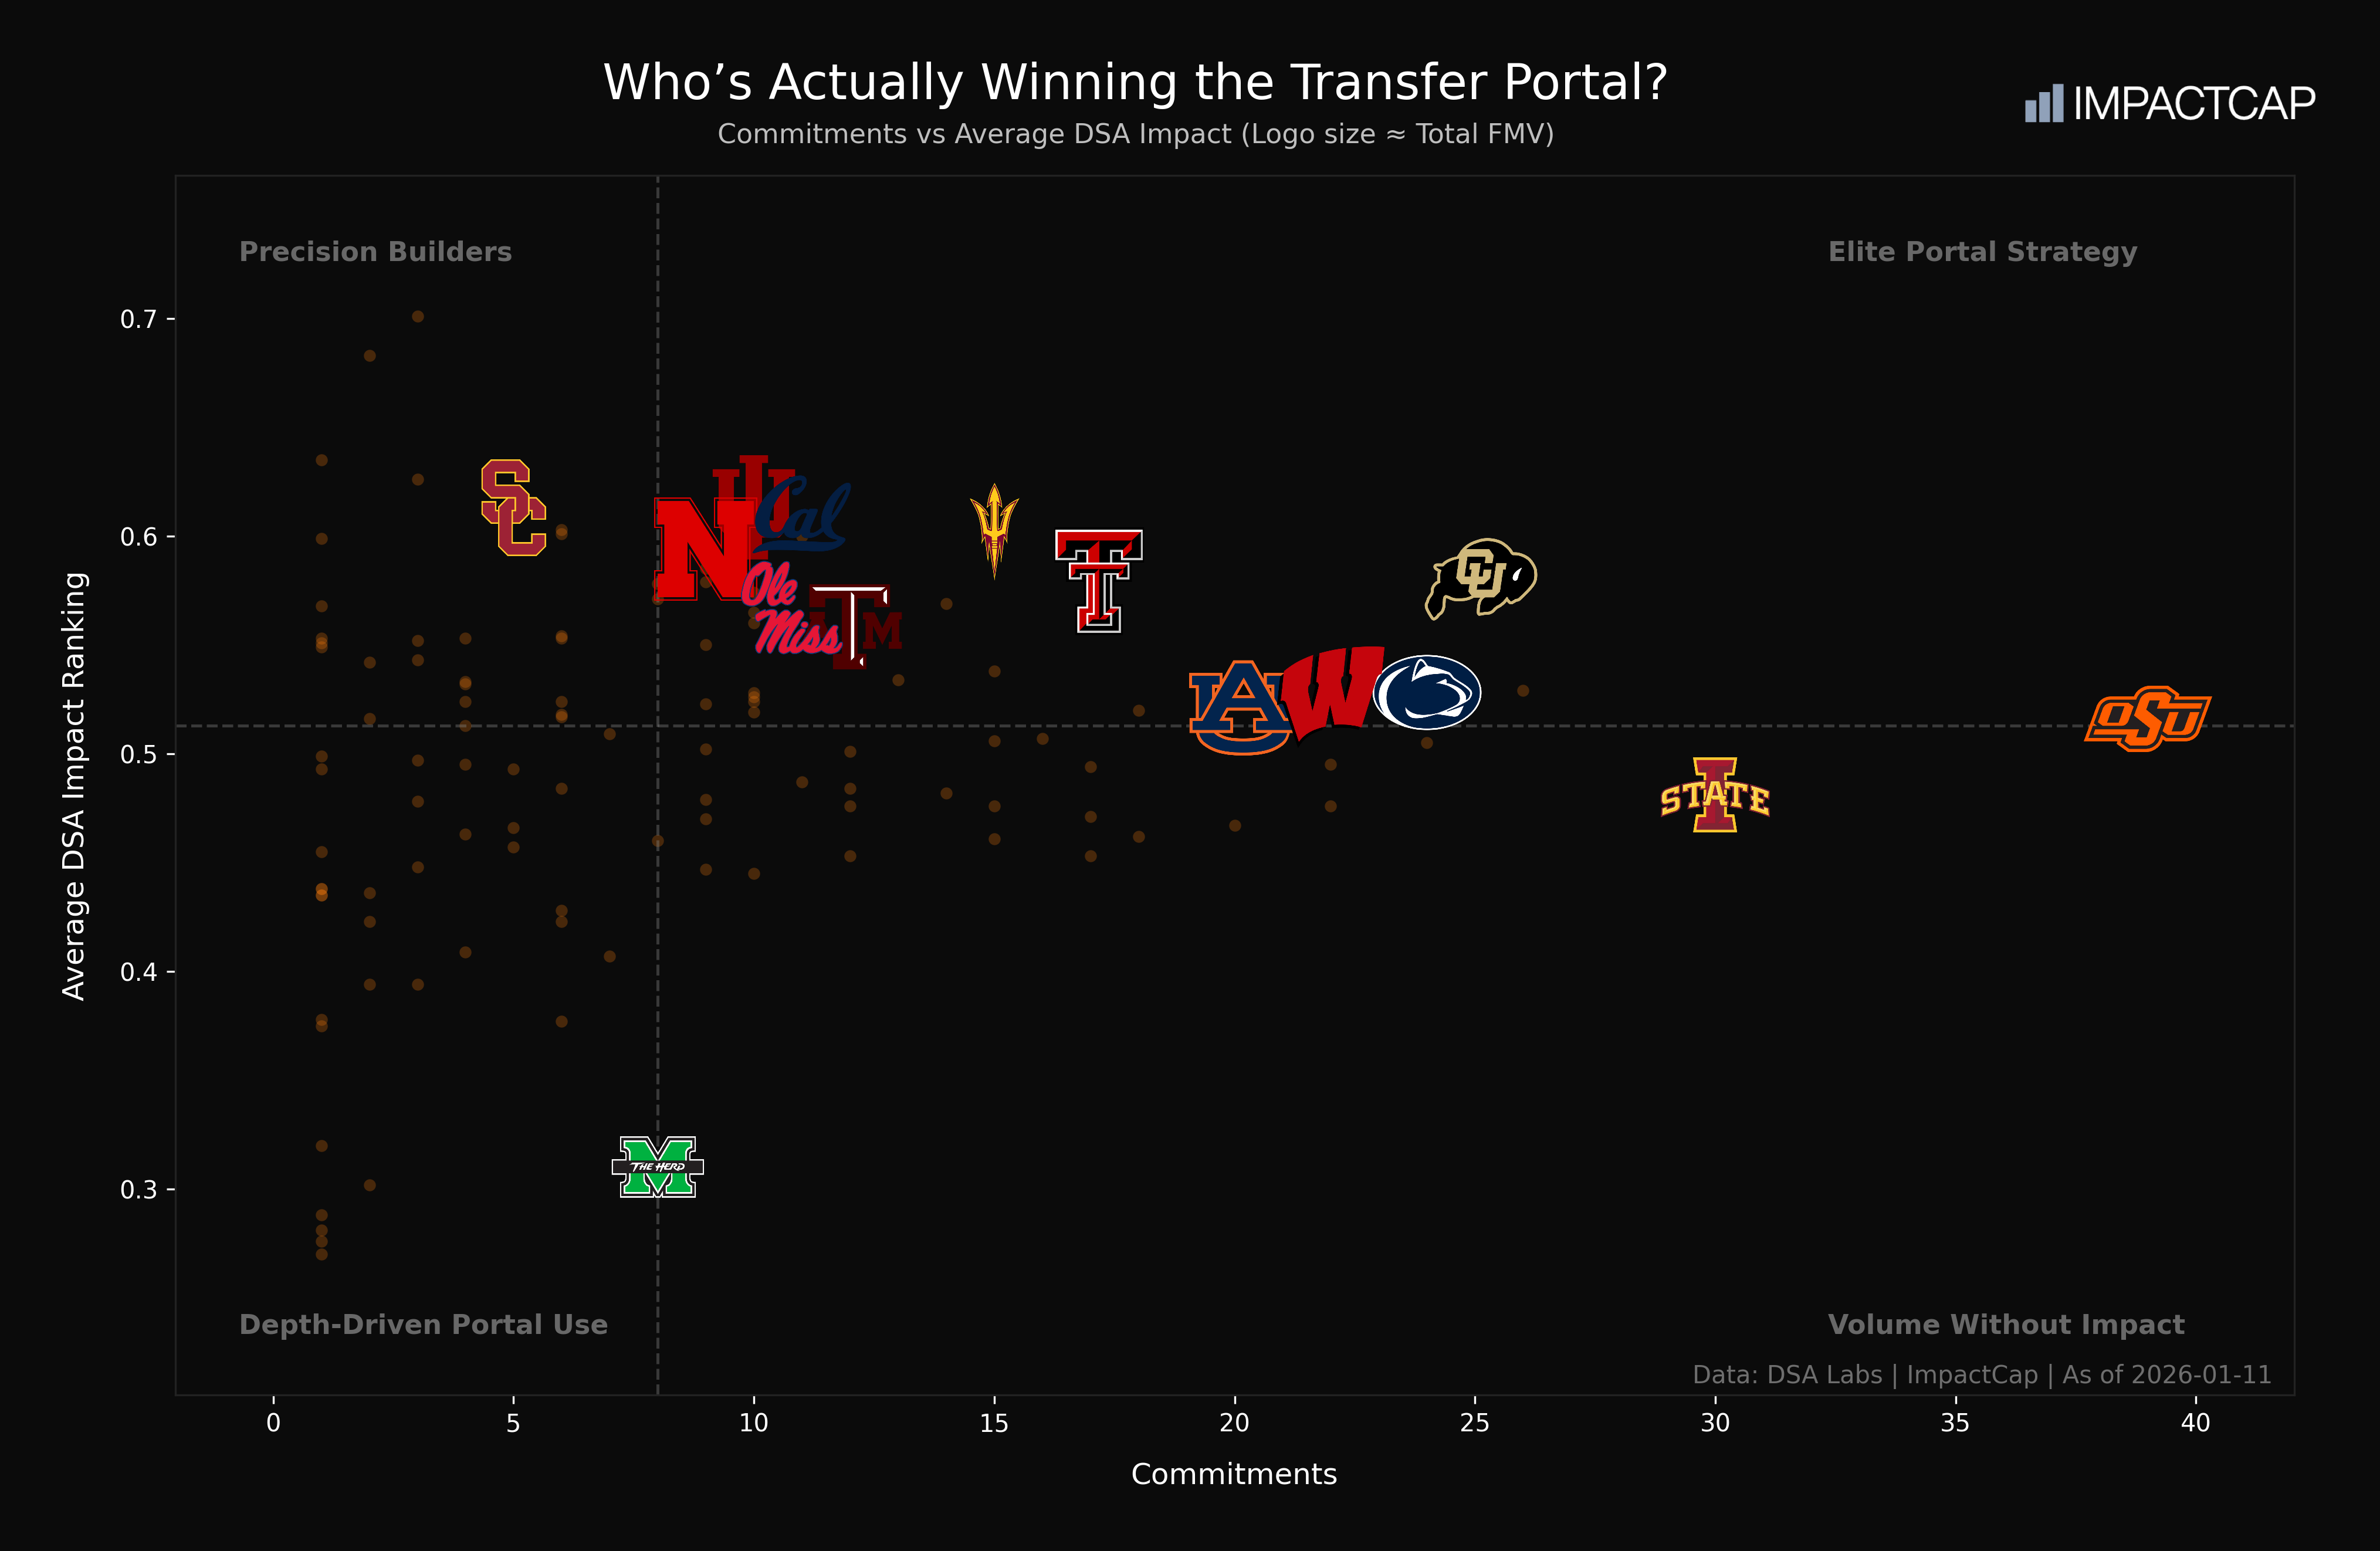
Commitments vs Average DSA Impact (Logo size ≈ Total FMV) — Data: DSA Labs | ImpactCap | As of 2026-01-11
Explore ImpactCap Transfer Portal Rankings
See these analytics in action at ImpactCap.io. Access comprehensive transfer portal rankings, real-time updates, and advanced filtering tools powered by DSA Impact Rankings and Fair Market Value analysis.