

A data team in the palm of your hands
StatLink transforms your raw data into actionable insights.
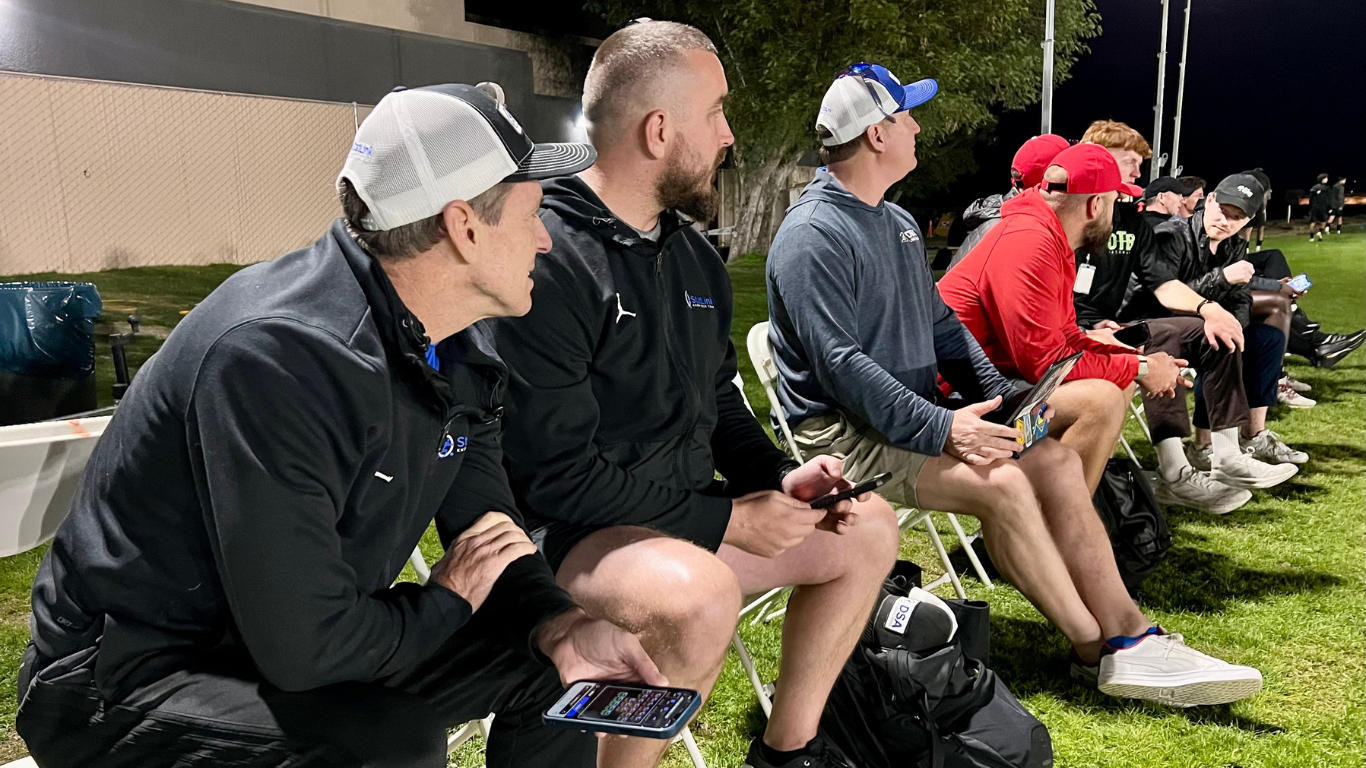
THE PROBLEM
COACHES ARE STILL USING A CLIPBOARD IN 2025

Data collection
Subjective Evaluations
Legacy Systems
“Eye Test” and “Gut Feeling” Decision Making
Lack of Automation
Not using data
A lot of data — little information
Turning data into decisions
“Eye Test” and “Gut Feeling” Decision Making
Lack of Automation
Technical Skill
Coaches don’t have the skill, know-how, or access to data scientists
Programs don’t have the budget
No digital infrastructure
Solutions
The cornerstone of DSA Labs's suite of products is StatLink, a software platform designed to integrate data from a multitude of sources and systems, enabling real-time situational awareness and data-driven decision-making.
StatLink is designed to ingest massive amounts of data from various sources, including wearables, coaching evaluations, and data providors, and apply advanced machine learning algorithms to model and visulaize performance simultaneously. We combine a sophisticated statistical inference engine with a simple, easy-to-use interface.

Product
Manager Dashboard
Coaches and administrators begin with a unified dashboard that surfaces the most critical insights in seconds. From optimized depth charts and lineup recommendations to high-level performance summaries and trend indicators, the Manager Dashboard provides one-click access to the metrics that matter most—so even small staffs can oversee multiple teams efficiently.
Player Profiles
Each athlete’s profile blends biometric data, performance stats, and subjective scout evaluations into a 360° view. Advanced statistical models forecast player potential, optimize lineups, and simulate “what-if” scenarios—giving coaches a predictive edge. All insights are delivered through simple dashboards and visual charts, ensuring that even non-technical users can pinpoint strengths, communicate specific goals, and measure improvement with tangible data.
Consulting
DSA Labs offer a comprehensive range of consulting services to help organizations at every stage of their sports analytics journey. This includes combines and ID events, talent identification, player valuations, implementation support, and custom software.
How it works

The Flywheel of StatLink Dynamism
At the heart of our platform is DSA Labs, which powers two interlocking flywheels—one driving your team’s on-field performance, the other maximizing your data ROI.
The Client Value Flywheel
More Data Integration
Bringing in wearables, video feeds, GPS, and historical stats creates a richer data foundation.Lower Cost
Consolidating data pipelines and automating workflows drives down administrative burden and tech spend.More Coaching
Freed from manual drudgery, your staff spends more time on high-impact coaching.Increased Data Provider Spend
As you demand new feeds and deeper granularity, providers invest in better coverage—expanding your integration possibilities.
The StatLink Performance Flywheel
More Capabilities
Each new feature—advanced analytics, automated scouting tools, custom reporting—expands what you can do.Better Scouting & Recruiting
With deeper insights, you identify talent faster and more accurately.More Focused Player Development
Coaches target training to each athlete’s strengths and weaknesses.Expanded Third-Party Services
As development accelerates, you integrate cutting-edge sports science, nutrition, and wellness partners—fueling another round of feature innovation.
Summary
Together, these two wheels create a self-reinforcing cycle: every new capability accelerates performance, and every efficiency gain amplifies your data ecosystem, powering sustained competitive advantage for your program.
The competition
Spreadsheets
Manual data entry — error prone & time consuming
Static, siloed reports with no real-time updates
No built-in sport specific analytics
Dashboarding
Collaboration-friendly but limited processing power
Version control headaches and formula breakage
Microsoft BI, Tableau, etc. simply display data — no real statistical modeling or analysis
Lack of Automation
Phds
Expensive data science teams
Not scalable across multiple teams & sports
Long lead times for bespoke analyses

Value Proposition
Automated and scalable statistical modeling. No data science knowledge required.
Simple but powerful analytics for predicting and visualizing performance.
Cost effective; works within any budget.
Integrate and centralize all of your data sources alongside your custom evaluations.
Turn your paperwork, Google Docs, Sheets, and Excel files into data that matters.
Manager Dashboard Workflow

-
Quick and Easy Team Onboarding
Upload your roster in minutes using an Excel spreadsheet or issuing a simple QR code.
Save time with seamless onboarding, ensuring all player data is organized in one place.
Focus on coaching while StatLink handles the logistics.

-
Customizable Tools to Measure What Matters
Choose an evaluation card from our extensive library or design one tailored to your needs.
Use our core characteristics and create your own customized metrics to evaluate players.
Define how you want to measure success—because you know your team best.

-
Effortlessly Capture and Integrate Player Statistics
Use our quick-entry system to record player performance in real time during games or practices.
Seamlessly integrate data from your favorite technologies and feeds to automate statistics collection.
Save time while ensuring accurate, up-to-date performance data.

-
Uncover Insights to Understand Your Team
Dive deeper into player and team performance with advanced ranking scores, intuitive dashboards, and detailed analytics tools.
Gain actionable insights to identify strengths, address gaps, and elevate performance.
Know your team better to make smarter, data-driven decisions.

-
Seamlessly Share Lineups With Your Network
Create and organize your lineups effortlessly, tailored to your strategy and goals.
Share lineups instantly with players, scouts, coaches, broadcast teams, and fans via email or QR code.
Keep everyone informed and engaged with your team’s latest updates.
Our Features

PREDICTIVE PLAYER RANKINGS

CUSTOM DATA ENTRY INTERFACE

TEAM REPORTS GENERATOR

LINEUP CREATOR

PLAYER TREND TOOL

PERSONALITY TRAIT INSTRUMENT

DEPTH CHART
"We used to juggle spreadsheets and manual tracking during training. Now, with StatLink, I can track KPIs in real time."
— Kristi Beckman, Loudoun United FC, USL Championship


“StatLink is revolutionizing how we evaluate athlete performance.”
— Brandon Moore, Head Coach, University of San Diego Football